Are you interested in boosting sales with the help of email marketing but don’t know how to analyze email marketing success? There are metrics for this. In this article, we will overview them. We have prepared the detailed description of the email marketing metrics and the infographics about them. Read further, and you will find out email marketing metrics definitions and how to use these rates for analyzing the effectiveness of your campaigns.
To understand if your mailing campaign is successful or not you should use the special services that show you some rates. For example, Atomic Email Tracker. Here are the main email metrics to track:
Let’s talk in more detail about them. What do these email metrics mean, how are they measured and what do they show? The answers to all these questions you will find further.
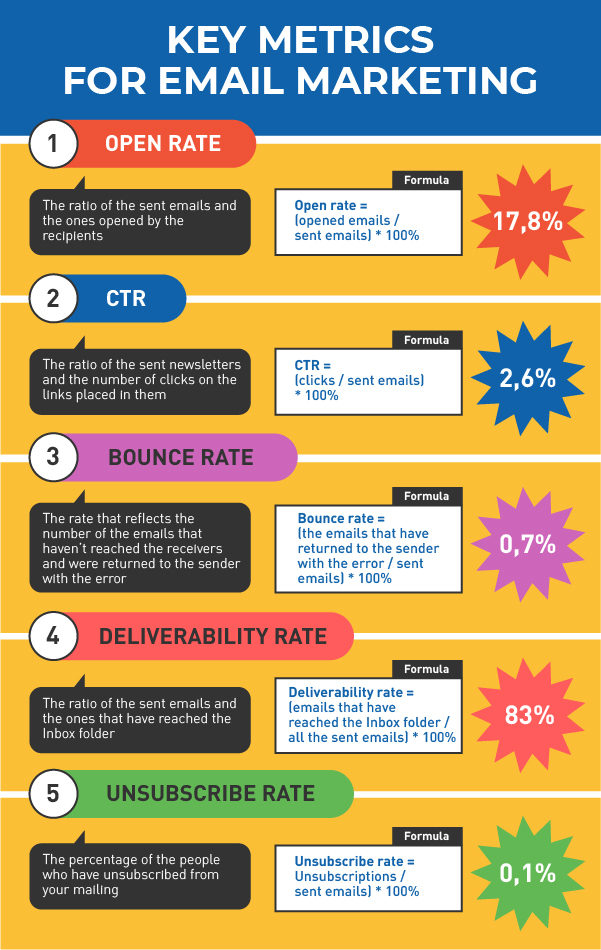
This is the ratio of the sent emails and the ones opened by the recipients. For example, you have sent 10.000 messages. 2.500 users opened them. So, (2.500 / 10.000) * 100% = 25%. This is your open rate.
As you can understand, the higher it is, the better. This means that more people read your messages. But don’t expect too high figures. Don’t be upset if you can’t reach 70% or 80%. 17,8% is the average open rate in email marketing in 2020 according to the Campaignmonitor survey . And this is accepted to be a good result.
This is one of the most important email marketing metrics. CTR is the ratio of the sent newsletters and the number of clicks on the links placed in them. For example, 300 users clicked the button with the call to action. The number of emails you have sent is 10000. So, (300 / 10000) * 100% = 3%. Is this a successful mailing campaign? This is a rather good result! 2,6% is the average email CTR believing the research by Campaignmonitor.
If click-through rates of your campaigns are much lower read another article from our blog and learn how to improve it.
This rate reflects the number of the emails that haven’t reached the receivers and were returned to the sender with the error. For example, you’ve launched the campaign with 10.000 recipients. And as a result, you’ve got 50 emails returned to you with errors. So, (50 / 1000) * 100% = 0,5%. This is a normal thing. 0,7% is the average email bounce rate according to the Campaignmonitor research for 2020.
But if the rate you’ve got is much higher check the validity of your email database. Most likely, there are many bad addresses, abandoned mailboxes, or even spam traps. All this influences the reputation of the domain you are sending emails from. If the bounce rate is high there is a risk that your next campaigns will go to the Spam folder.
You can make the conclusion that if your bounce rate is 0,7%, the other 99,3% have reached the receivers and can be read. But don’t hurry with the outputs. Not all the emails that were not returned to the sender with the error have really reached the Inbox. Some of them have appeared in the Spam or Promo folders. And there is the rate that helps you to understand the number of such newsletters. Deliverability rate shows how many emails have reached the Inbox folder and how many of them are in Spam or Promo. 83% is the average deliverability rate in 2019 in the whole world, according to the 2020 Email Deliverability Benchmark. So, if the bounce rate is 0,7%, and the deliverability is 83%, 16,3% of the newsletters go to the Spam or Promo folders.
This is one of the significant email marketing metrics. It reflects the percentage of the people who have unsubscribed from your mailing. For example, the number of recipients is 10.000, and 20 people have rejected receiving your messages in the future. So, the rate is (20 / 10000) * 100% = 0,2%. This is a bit high figure. And it can mean that:
What unsubscribe rate is OK? 0,1% is the average figure in 2020, according to a Campaignmonitor investigation. If the rate is higher, find the reason and solve the problem.
Monitor the listed in the article email campaign metrics, and analyze if your marketing is effective. Aim at the average rates that we have mentioned. If you’ve got better results, this is great. But if your rates are much poorer than average ones, look for the problems in your address list, newsletters quality, or email marketing strategy.
Atomic Email Tracker will help you to monitor metrics for email marketing. Activate the demo version, and use it for free for 7 days!


Subscribe to us and you will know about our latest updates and events as just they will be presented